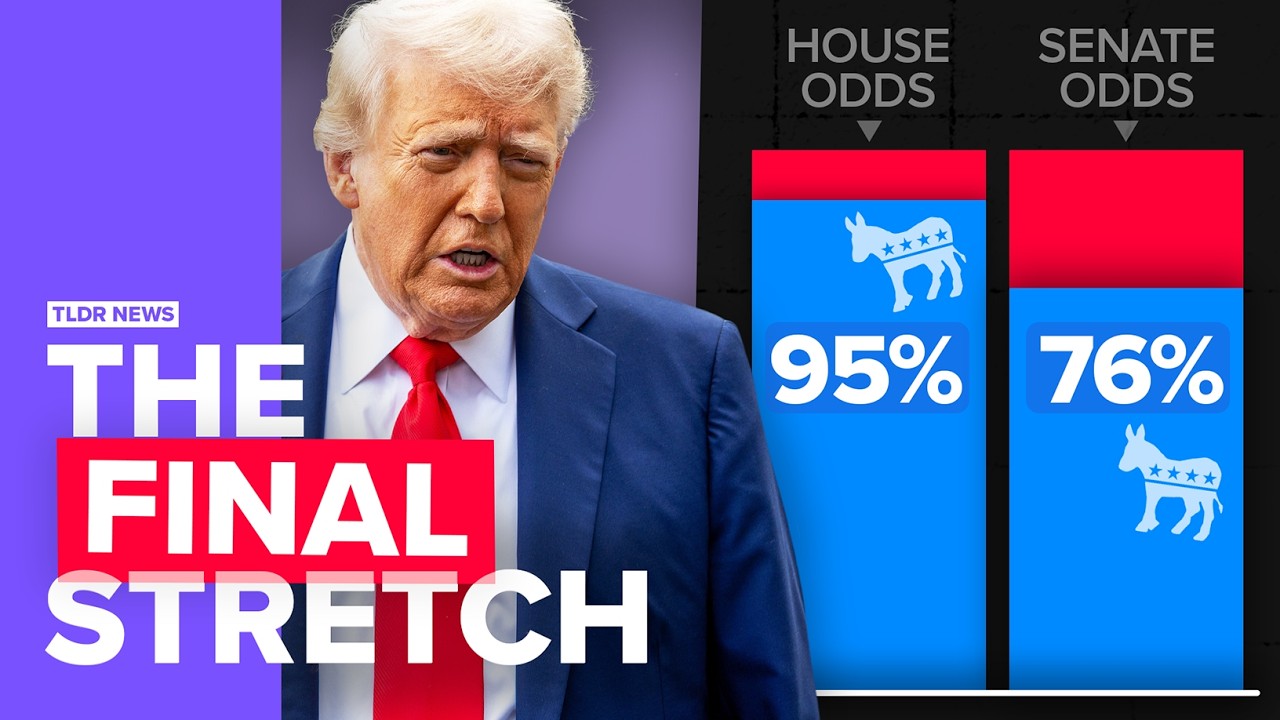
Why the Final Midterm Polls Look Bad for Trump (But Could They Be Wrong?)
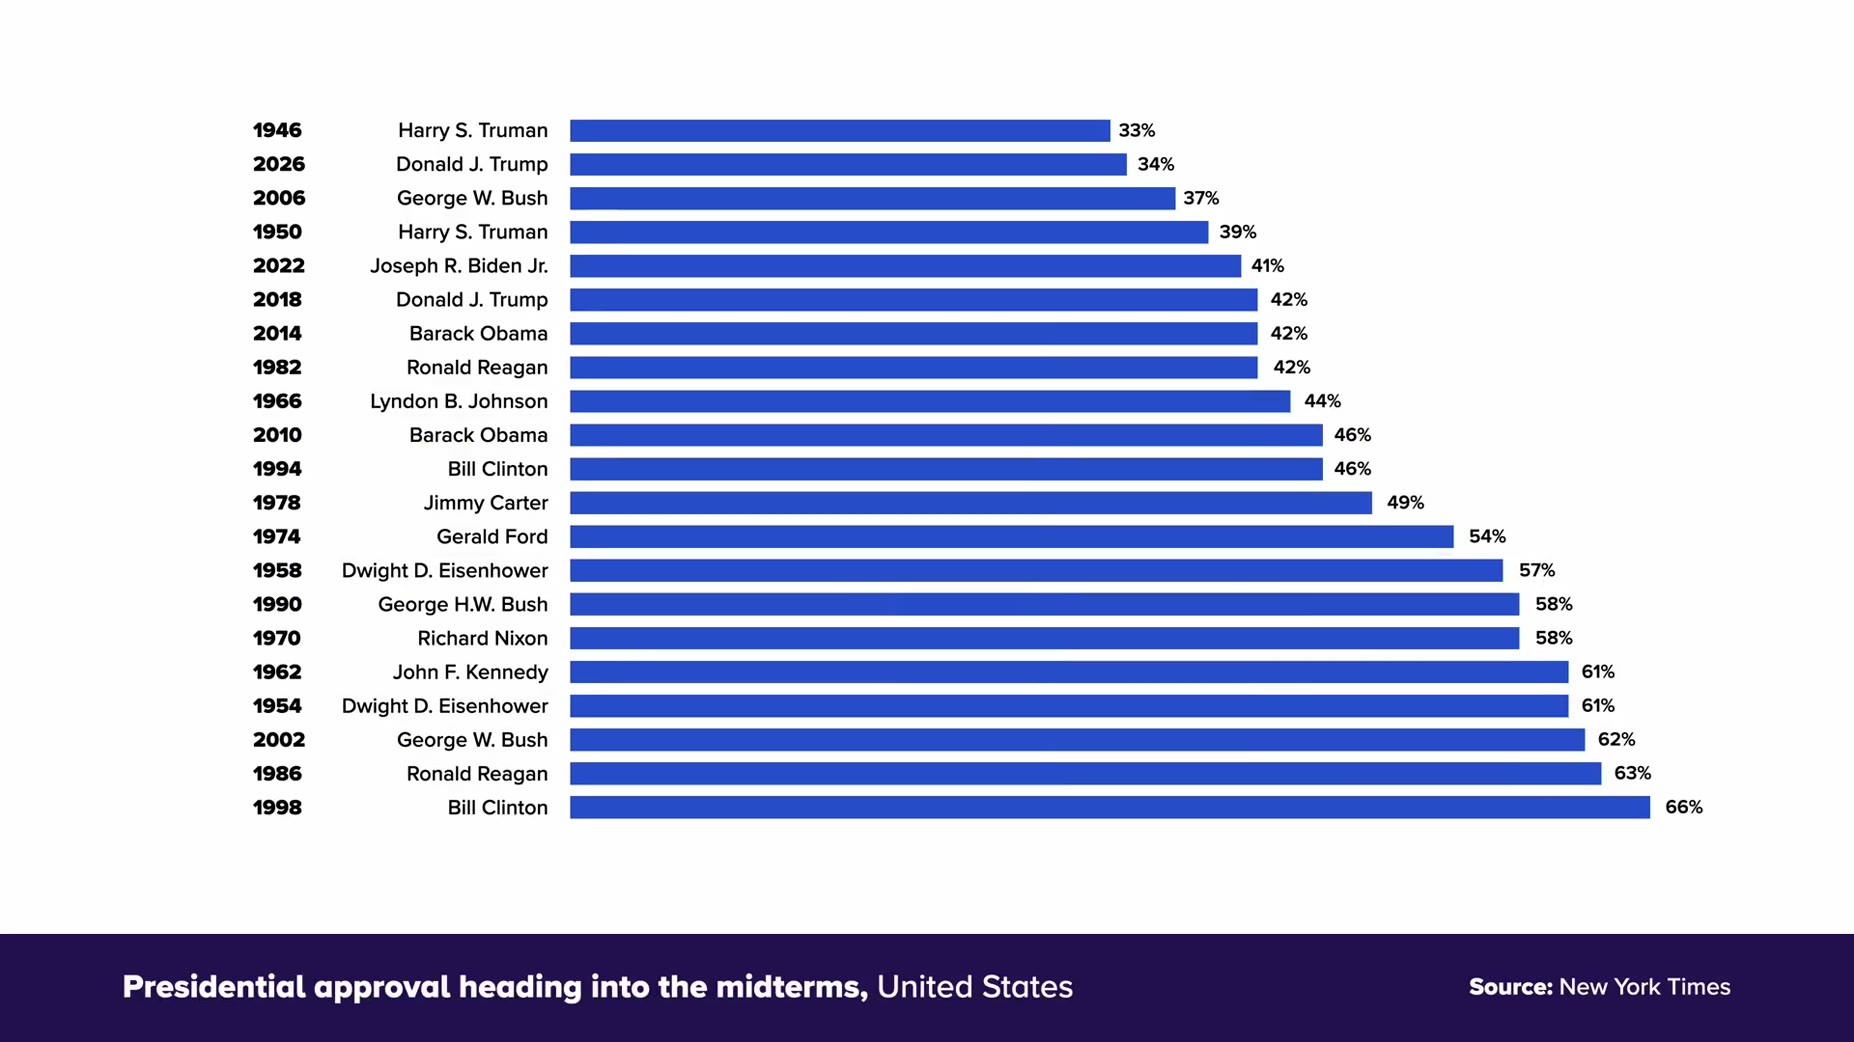
Nate Silver's polling average puts Trump's net approval at around negative 23, and the New York Times reported his 34% approval was the lowest for any president heading into a midterm since Truman in 1946, whose party then suffered heavy losses. Multiple forecasters, including The Economist, Nate Silver's model, Race to the White House, Elect It and Decision Desk HQ, show Democrats favored to retake the House and, with more varied probability estimates ranging 54% to 77%, the Senate. The video's narrator argues these numbers mean Trump's final two years could be reshaped by investigations, impeachment moves and blocked legislation if both chambers flip, but the narrator also caveats that polls underestimated Republicans in the last three presidential elections and that the real outcome will only be known once votes are counted.
Confirmed: Nate Silver's polling average puts Trump's net approval rating at around negative 23, called historically bad [01:51]
- Source cited: The New York Times reported Trump's 34% approval was the lowest for any president heading into a midterm since Harry Truman in 1946 [01:58]
- Confirmed: In 1946, Truman's Democrats went on to suffer heavy losses to Republicans [01:58]
- Confirmed: Nate Silver's average shows Trump deep underwater on four main issues, immigration, trade, economy and inflation, with inflation falling the most [02:16]
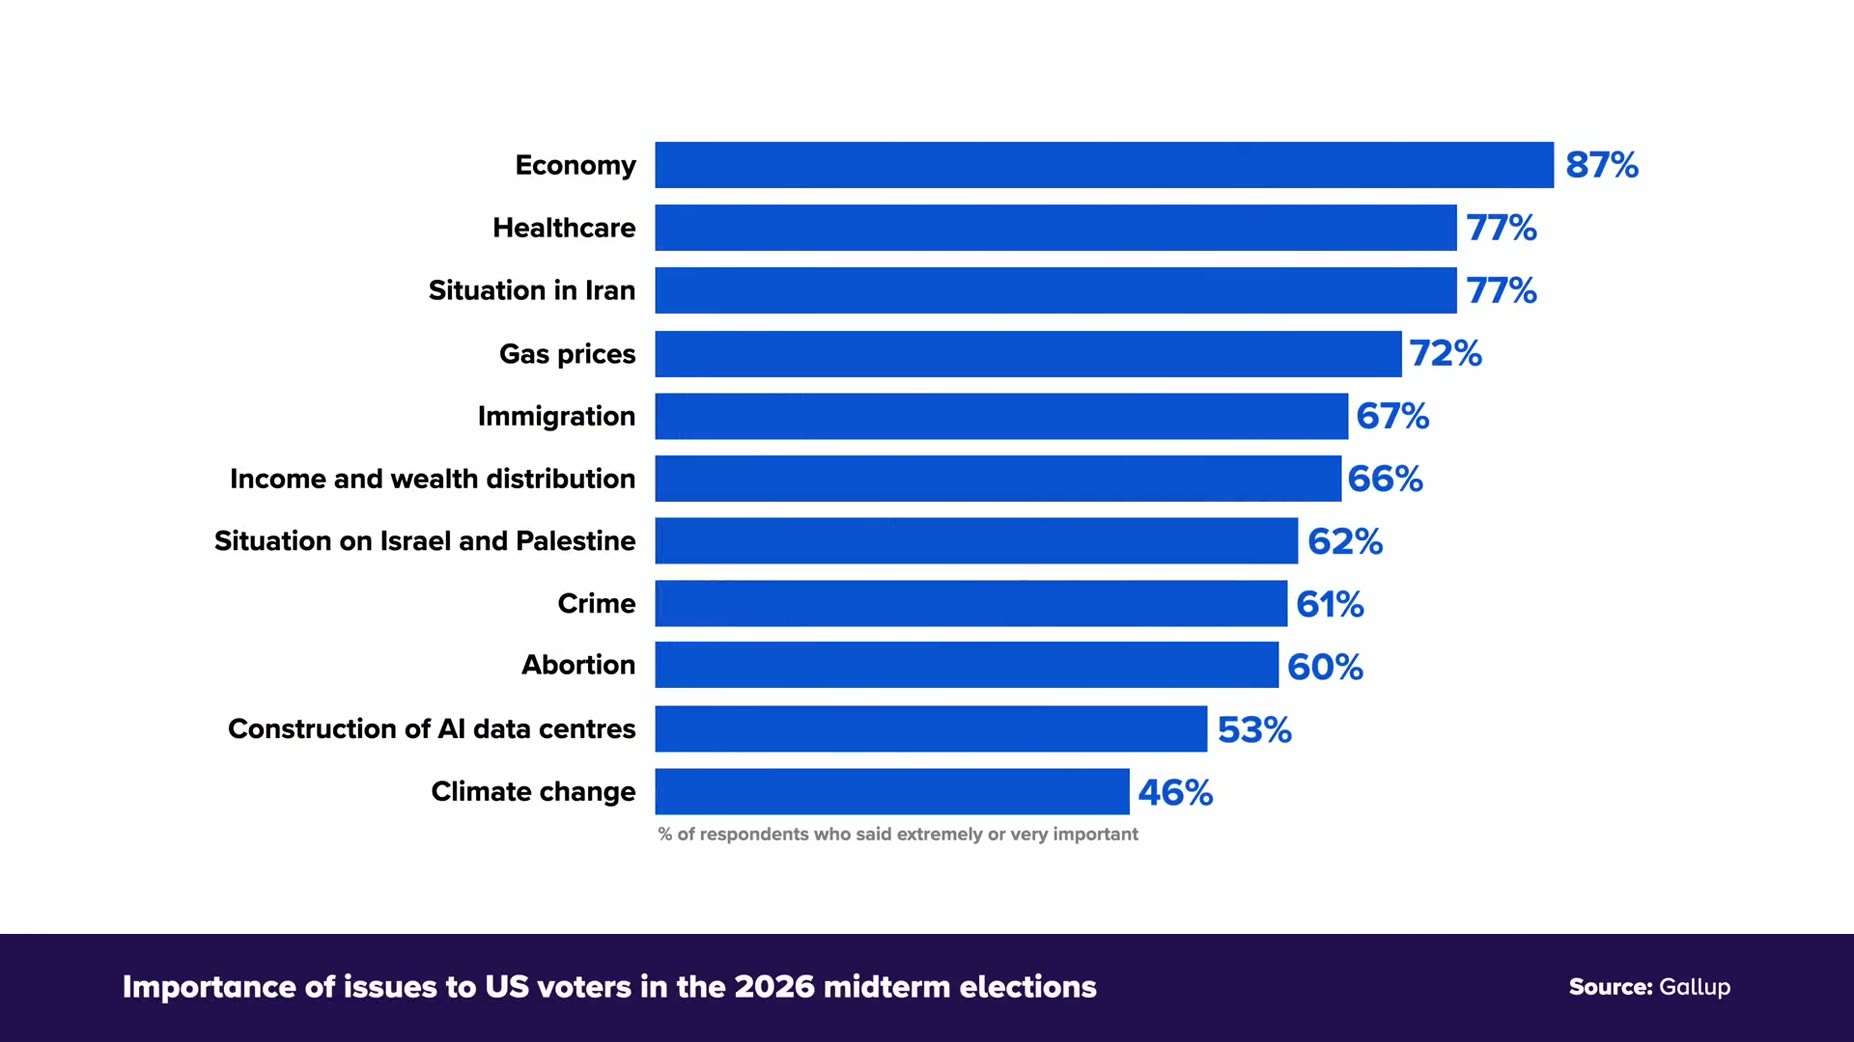
- Source cited: A Gallup-sourced chart shows economy and inflation are consistently ranked by voters as the top issue heading into the midterms [02:25]
+ 22 more takeaways
- Confirmed: Trump spent his final days of campaigning in deep red states like Mississippi and South Carolina [00:17]
- Take (narrator): This reflects lowered expectations compared to a few months earlier [00:17]
- Confirmed: Democrats are currently favored to gain control of the House and are increasingly favored to take the Senate [00:28]
- Take (narrator): This is aided by strong candidate choice and Trump's poor approval ratings [00:28]
- Prediction: Flipping both chambers would reshape Trump's final two years in office, raising the prospect of investigations, impeachment, and blocked nominations and legislation [00:40]
- Confirmed: The generic congressional ballot asks voters whether they would choose a Republican or Democratic candidate in a House election, used as the best gauge of nationwide voting intention [02:39]
- Confirmed: Democrats currently lead the generic ballot by 8 to 9 points across various averages [02:54]
- Source cited: Forecasts from The Economist, Nate Silver's Race to the White House, Elect It, and Decision Desk HQ show Democrats strongly favored to win the House, with most projecting a seat count in the upper 230s versus the 218 needed for a majority [03:00]
- Confirmed: To take the Senate, Democrats need to hold all current seats and flip at least four Republican-held seats, including at least two Trump won by double digits in 2024 [03:23]
- Source cited: Senate control probability estimates for Democrats are 76% from Nate Silver's model, 77% from Race to the White House, 74% from Harvard's Elect It, and 54% from The Economist [03:45]
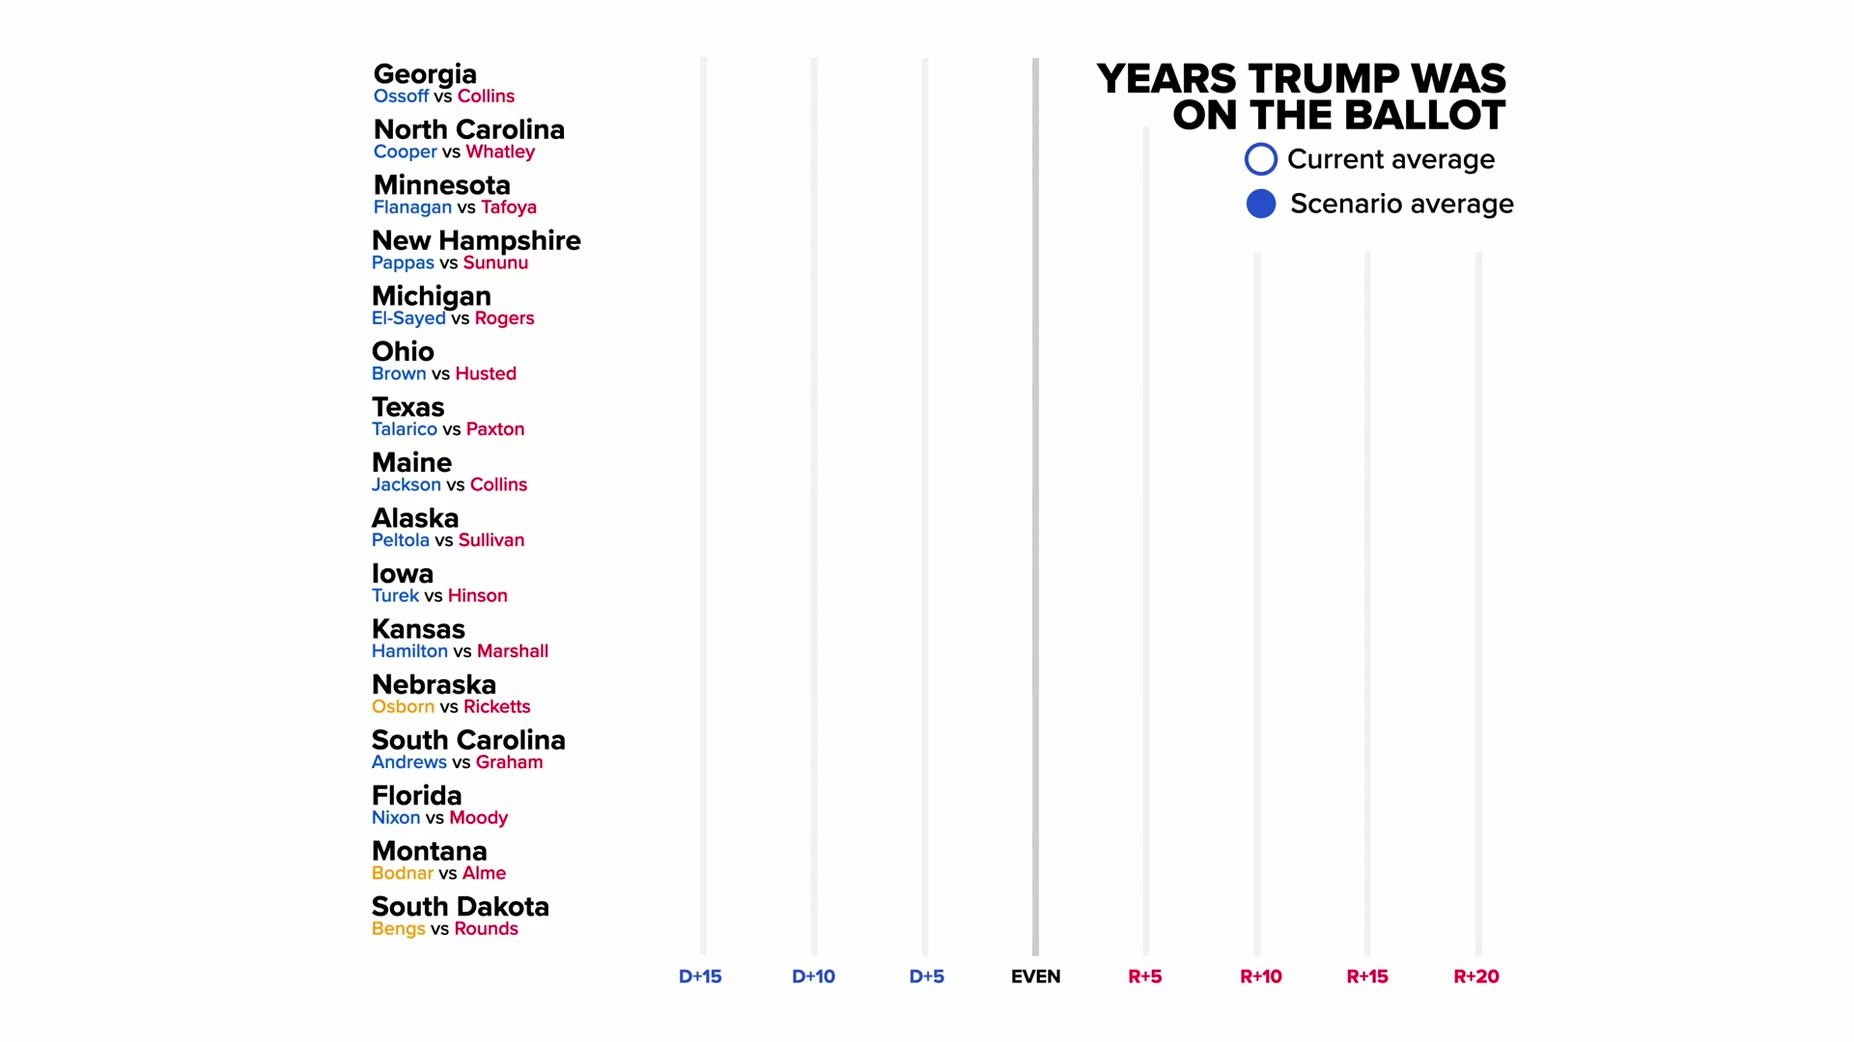
- Confirmed: Nate Silver's state polling averages show Democrats leading in Alaska, Iowa, Kansas, Maine, North Carolina, Ohio and Texas [03:59]
- Prediction: If those leads hold, Democrats would gain 54 Senate seats, up from their current 47 [03:59]
- Confirmed: In the last three presidential elections, 2016, 2020, and 2024, polls generally underestimated Republicans [04:43]
- Source cited: Data journalist G. Elliott Morris at 50 Plus 1 modeled key Senate races assuming a 2016/2020/2024-level polling error [04:50]
- Prediction: That modeled polling error would put the Democratic Senate majority out of reach and flip several states to Republican leads [04:50]
- Confirmed: Applying the average 2018-2022 polling error to current Senate race polling, Democrats hold almost all of their leads [06:01]
- Confirmed: Under the 2018-2022 error model, Democrat leads grow in Texas, Maine and Kansas, their lead in Ohio is cut, and Michigan becomes a toss up [06:09]
- Take (narrator): The data does not mean there are only two options for how the midterms could go [06:17]
- Take (narrator): It could be neither a 2024 Republican-style underestimation nor a 2022-style broad accuracy, since last year's off-year elections showed something different [06:27]
- Confirmed: Democrats were underestimated by 5 to 10 points in the New Jersey and Virginia gubernatorial elections [06:32]
- Take (narrator): Polls being wrong is not necessarily synonymous with underestimating Republicans [06:38]
- Open question: The true answer on polling accuracy and direction will only be known once the elections happen and all votes are counted [06:43]
How this brief was shaped: News Analysis / Commentary · confidence Medium
Transcript walks through confirmed polling numbers, Trump approval ratings, and historical comparisons (Truman 1946) while also offering the narrator's read on what it means for both parties, and the OCR shows a Nate Silver approval chart and a detailed state-by-state Senate and Governor forecast grid rather than a fixed procedure or product.
The lens sets this brief's structure, never its facts — every claim is held to the same citation and fact-check standard.